
Every publish job in PDMPublisher ends in the Publishing results window, and every question that follows a job (“where did the PDF go?”, “why was this part skipped?”, “what failed?”) is answered there or in the log behind it. This article reads a real results window line by line, explains the counts, the skip reasons and the -At suffix, then covers the Logs command in the SOLIDWORKS add-in and the log files the PDM Professional task writes into the vault.
What the window is for
The Publishing results window is the receipt for a job. It opens automatically when a Publish run finishes and can be reopened at any time from PDMPublisher > Logs, which shows the same window with every run of the current SOLIDWORKS session available in its run selector. It answers three things per output: what was produced, where it was written and why it was or was not produced.
The window is organized as a tree: a source file, the configurations that were evaluated for it, and under each configuration the outputs (PDF, STEP, DXF, ZIP, merged master PDF). A second tab, Detailed log, keeps the chronological processing record for the same run. Nothing in the window changes the profile; it is read-only reporting.
Why it matters
A publish job on an assembly can touch dozens of files, several configurations each, and several formats each. Without a structured result, the only way to know what happened is to browse the export folder and guess. A release package sent to a supplier with one missing drawing, or a STEP that silently failed on a corrupt reference, is exactly the kind of problem that gets caught here and nowhere else.
The window also turns support requests from a description into evidence. The run selector, the counts, a selected output’s technical message and the saved log are what Blue Byte support asks for first.
The header: run selector and summary line
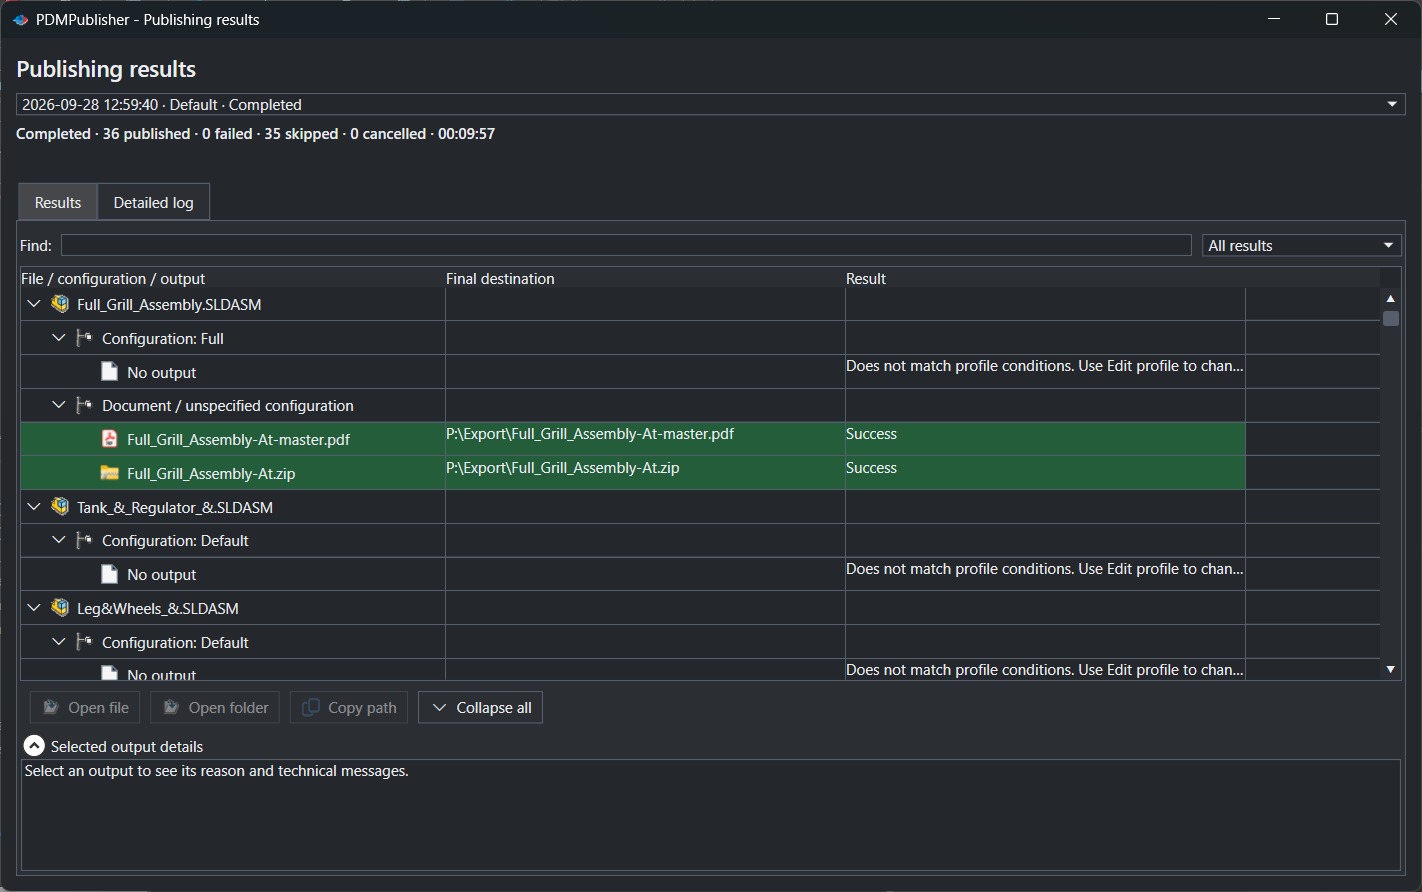
The first control under the Publishing results title is the run selector, a dropdown that reads 2026-09-28 12:59:40 · Default · Completed in the screenshot: the timestamp the job started, the Publish profile it used and its overall outcome. Open the dropdown to switch to an earlier run from the same SOLIDWORKS session.
Directly beneath is the summary line: Completed · 36 published · 0 failed · 35 skipped · 0 cancelled · 00:09:57. Read it as: the job ran to the end; 36 outputs were written; no output errored; 35 items were excluded before export; the operator did not cancel; the whole job took 9 minutes 57 seconds. These are output counts, not file counts. One source file with a PDF and a ZIP contributes two to published; one configuration rejected by conditions contributes one to skipped.
| Summary item | Meaning | What to do |
|---|---|---|
| Overall outcome (Completed, Warning, Error, Cancelled) | Whether the job ran to the end and how cleanly. | Completed: spot-check the destination. Error: save the log and correct the cause. |
| published | Outputs that were produced and written to their final destination. | Use Open file / Open folder on the green rows to verify. |
| failed | Outputs that could not be exported or whose post-processing step failed. | Filter to failures, select the row, read Selected output details. |
| skipped | Items excluded before export: conditions, no associated drawing, unsupported source/format combination, missing input or operator choice in the review dialog. | Confirm each skip was intended; the Result column gives the reason. |
| cancelled | Items not processed because the operator cancelled the review or the running job. | Files completed before cancellation remain in the output folder. |
| Elapsed time (hh:mm:ss) | Duration of the run. | Compare runs to spot slow references or formats. |
The Results tab: tree, columns and filters
The Results tab starts with a Find box and a result filter dropdown, All results by default. Find matches filenames, configuration names, destinations and result reasons as you type; the filter narrows the tree to one outcome so you can look only at failures or only at skips. Both are display filters; nothing is removed from the run.
The tree has three columns. File / configuration / output is the hierarchy: a source file with an assembly, part or drawing icon; beneath it one node per configuration, named Configuration: Full or Configuration: Default, plus a node named Document / unspecified configuration for outputs that belong to the document as a whole rather than to one configuration; beneath those, the outputs with a PDF, folder or file icon, or a No output placeholder when nothing was written. Final destination shows the full path of each written output, for example P:\Export\Full_Grill_Assembly-At-master.pdf. Result holds Success for green rows and the reason text for everything else, such as Does not match profile conditions. Use Edit profile to change….
In the screenshot, Full_Grill_Assembly.SLDASM expands to Configuration: Full with No output and a conditions reason, and to Document / unspecified configuration with two green rows: Full_Grill_Assembly-At-master.pdf, the merged master PDF, and Full_Grill_Assembly-At.zip, the archive of all exported documents. Tank_&_Regulator_&.SLDASM and Leg&Wheels_&.SLDASM follow with the same shape: their Configuration: Default nodes were skipped by conditions, which is the expected outcome for a profile whose conditions pass parts only.
| Control | What it does | Notes |
|---|---|---|
| Run selector | Chooses a run from the current SOLIDWORKS session; shows start time, profile and outcome. | Runs are kept in memory for the session. |
| Results tab | Hierarchical view of source files, configurations and outputs. | Default tab. |
| Detailed log tab | Chronological processing log for the selected run. | Same entries as the Logs window for that run. |
| Find | Filters rows by filename, configuration, destination or reason as you type. | Not case sensitive; display only. |
| Result filter (All results) | Narrows the tree to one outcome. | Use it to isolate failures or skips. |
| File / configuration / output column | Source file → configuration → output hierarchy. | No output marks a node that produced nothing. |
| Final destination column | Full path of the written output. | Empty for skipped or failed outputs. |
| Result column | Success or the reason text. | Green background for success. |
| Open file | Opens the selected output in its default application. | Enabled only for a written output. |
| Open folder | Opens the destination folder of the selected output. | Enabled only for a written output. |
| Copy path | Copies the selected output’s full path to the clipboard. | Paste into an email or ticket. |
| Expand all / Collapse all | Expands or collapses the whole tree. | Label toggles with the tree state. |
| Selected output details | Collapsible pane showing the selected output’s reason and technical message. | Reads Select an output to see its reason and technical messages. until a row is selected. |
Reading a skipped row
A skipped row is not an error. It means PDMPublisher decided, before export, that this item should not be produced. The Result column names the cause, and selecting the row shows the full text in Selected output details. The causes fall into a few categories.
- Does not match profile conditions. Use Edit profile to change… The configuration failed the profile’s condition tree. In the screenshot every assembly configuration carries this reason because the profile’s conditions pass
*.sldprtonly. Open PDMPublisher > Conditions to adjust the tree; see The Conditions editor explained. - No drawing to export. The profile exports drawing output such as PDF from the same-name
.slddrwand no drawing was found for this part or assembly. Check the drawing name and location, or the PDM search option in the task. - Unsupported source and format combination. A requested format does not apply to the source type, so no output is produced for that file.
- Missing input. A reference could not be resolved or was not cached locally. Do a Get Latest on the assembly and references, then rerun.
- Cleared in the review dialog. The operator unticked Use for the file before publishing. This affects only that run.
The Warning outcome sits between success and skip: processing continued but a fallback or nonfatal issue occurred, for example a Sheet Name Pattern that matched no sheet and fell back to exporting all sheets. Read the preceding log entries and verify the affected file before the output is sent out.
The -At suffix and other naming you will see
Two of the green rows are named Full_Grill_Assembly-At-master.pdf and Full_Grill_Assembly-At.zip. The At is the (ConfigurationName) placeholder resolved for the PDM @ configuration: PDMPublisher writes @ as At in output names. Outputs grouped under Document / unspecified configuration therefore carry -At when the filename pattern includes the configuration placeholder.
-master is the merged master PDF produced when Merge exported PDFs is on; it collects every component PDF from the run into one document, in the order and with the bookmarks the profile defines. The .zip is the archive produced by Archive all exported documents. Both are document-level outputs, which is why they hang under the document node rather than a configuration node. See Merge multiple drawings into one PDF.
The Detailed log tab
Switch to Detailed log and the same run is shown as a chronological list of messages: job start, each file and configuration picked up, condition evaluation, calculated quantities, drawing sheets found, each export, each save, warnings and failures. Where the Results tab tells you what, the Detailed log tells you in what order and with which intermediate values, which is what you need when a placeholder resolved to something unexpected or a quantity looks wrong.
Read the entries around a warning or failure, not only the highlighted line. Earlier messages usually name the source file, configuration or evaluated value that led to the result.
The Logs command: session history, filters and Save
PDMPublisher > Logs on the CommandManager opens the results window for the whole session, and the Publishing logs view collects every message from every run. Its toolbar has a Find box and a type filter offering All entries, Errors, Warnings, Completed, Processing and Skipped. A status bar reports shown, total and selected counts, so it is always clear whether a filter is hiding entries; Follow newest keeps the list scrolled to the latest entry while a job runs.
Entry colors carry meaning: yellow for job start, processing and progress; green for saved, completed, added or passed steps; light red for warning, failed or error entries.
The buttons at the bottom preserve or clear the record. Copy selected and Copy all put entries on the clipboard for a quick paste into a ticket. Save… writes the complete session log, including entries hidden by the filter, to a .log or .txt file with a suggested name containing the product name, computer name and job session identifier. Clear empties the in-memory list; it does not delete files already saved, and cleared entries cannot be restored, so save first. Close dismisses the window.
Task-side logs in PDM Professional
The PDM Professional task has no interactive window; it runs on a task host, often unattended. Its record is a log file, and three task options control it. Vault Activity Logs creates detailed task logs showing the steps performed during publishing; enable it while validating a new task or troubleshooting. Log Folder (Vault Only) sets the vault folder the log files are deposited in; the recommended path is (VaultRootFolder)\Logs\PDMPublisher, created manually beforehand, inside the vault, with no trailing backslash, and the task host account must be allowed to add files there. Server-Synced Activity Logs additionally sends those logs to the server for support review; enable vault activity logs first, and check company policy if filenames, paths or variable names are sensitive.
For a quick view without opening the file, the task’s Task Details Log tab lists the files that were successfully converted and checked into PDM, with columns Timestamp, Destination File, Ver, Original File and Found In. It is a presentation of the actual task log, so logging must be enabled and the user must be able to read the log file, its folder and its workflow state. Files saved outside the vault are not listed. Open Log File opens the original log for the full record, including failures and outputs written outside PDM.
| Task option or control | What it does | Notes |
|---|---|---|
| Vault Activity Logs | Writes a detailed step-by-step task log. | Enable for validation and troubleshooting. |
| Log Folder (Vault Only) | Vault folder that receives the log files. | (VaultRootFolder)\Logs\PDMPublisher; create it first; no trailing backslash; task host needs add permission. |
| Server-Synced Activity Logs | Sends activity logs to the server for support review. | Requires Vault Activity Logs; confirm company policy. |
| Task Details Log tab | Table of successfully checked-in outputs read from the task log. | Vault outputs only; needs read access to the log file. |
| Open Log File | Opens the original task log file. | Use when the Details tab is empty or a task partially failed. |
| Help | Opens the task documentation page. |
If the task cannot check in its log file, verify the task host account’s folder and workflow permissions on the log folder and make sure the
.txtextension is not excluded by the vault’s auto-add user setting.
Read a run in the SOLIDWORKS add-in
- Run PDMPublisher > Publish. The Publishing results window opens when the job finishes; or open PDMPublisher > Logs later and pick the run from the selector.
- Read the summary line. If failed is not 0, set the result filter to failures; if skipped is higher than expected, set it to skips.
- Select a row. Read Selected output details for the reason and technical message. Use Open file or Open folder on a green row to verify the output, Copy path to share it.
- Type a filename, configuration or the word
warningin Find to jump to a specific item. - Switch to Detailed log for the sequence of events around the item.
- Before contacting support, open the Publishing logs view and select Save… immediately after the job, so later runs are not mixed into the file.
Read a run in the PDM Professional task
- In the PDM Administration tool, open the PDMPublisher task and enable Vault Activity Logs; set Log Folder (Vault Only) to a vault folder you created, such as
(VaultRootFolder)\Logs\PDMPublisher. - Run the task from the right-click Tasks menu, a workflow transition or a schedule.
- Open the task’s Task Details Log tab to see the checked-in outputs with timestamp, destination, version, source and folder.
- If the table is empty or the run partially failed, select Open Log File and read the messages before the failure.
- Optionally enable Server-Synced Activity Logs so support can review the same log without a manual upload.
Send logs to support
- Add-in. Save the session log with Save… right after the job. Attach the saved
.logfile, the Publish profile name, the source filename and the expected output to the request. Emailsupport@bluebytesystemsinc.zohodesk.com. - Task. Attach the task log file from the log folder, or enable Server-Synced Activity Logs and mention the vault and task name. Include the source filename and the transition or command that launched the task.
- Both. A screenshot of the results window with the failing row selected and Selected output details expanded saves a round trip.
Tips, limits and troubleshooting
- Runs disappear when SOLIDWORKS closes. The run selector and the Publishing logs list are in memory for the current session. Save what you need with Save….
- The exported files are not where I expect. Read Final destination rather than guessing; per-format locations and placeholders can move outputs. In the task, the export location must be a vault or share folder where the task host has permission to add and edit files; the vault root is usually locked.
- Skipped is high but nothing is wrong. A parts-only condition tree skips every assembly configuration by design, as in the screenshot’s 35 skips. Filter the tree to skips and confirm the reasons are all conditions.
- Cancelled run left files behind. Cancelling does not roll back files already exported. Inspect the destination before rerunning so a partial result is not mistaken for the new job.
- Warning on a merged PDF font. The Cannot find or create the font ‘Helvetica-Bold’ message comes from the PDF reader; install the font on the viewing machine.
- Task Details tab is empty. Logging is off, the outputs were saved outside the vault, or the user cannot read the log file, its folder or its workflow state. Ask the PDM administrator to verify permissions and the log location.
- Community Edition. Results and logs are fully available in the free add-in; only formats and the 5-references-per-run limit differ from Premium.
Availability
Available in PDMPublisher for SOLIDWORKS (the add-in) and PDMPublisher for PDM Professional (the task). The Publishing results window and the Logs command belong to the SOLIDWORKS add-in. The PDM Professional task records its work in task log files instead: the Task Details Log tab, vault activity logs and the log folder described below.
Documentation and related features
- Publishing Logs in the SOLIDWORKS add-in
- Log Folder (Vault Only) task option
- The Conditions editor explained
- Run as a SOLIDWORKS PDM task
- SOLIDWORKS assembly documents
- Merge multiple drawings into one PDF
- The Annotations editor explained
Frequently asked questions
What do published, failed, skipped and cancelled mean in PDMPublisher results?
They count outputs, not files. Published outputs were written to their final destination; failed outputs errored during export or post-processing; skipped items were excluded before export by conditions, a missing drawing, an unsupported format or the review dialog; cancelled items were not processed because the operator cancelled.
Why does PDMPublisher say Does not match profile conditions?
The configuration failed the profile’s condition tree, so no output was produced for it. Open PDMPublisher > Conditions on that profile to review the rules; this is the expected result for assembly configurations under a parts-only tree.
What does -At mean in a PDMPublisher output filename?
It is the (ConfigurationName) placeholder resolved for the PDM @ configuration. PDMPublisher writes @ as At because @ is not used in output names. -master marks the merged master PDF.
Where are PDMPublisher logs saved?
In the SOLIDWORKS add-in, logs are kept in memory for the session and saved to a .log or .txt file with Save… in PDMPublisher > Logs. In the PDM task, Vault Activity Logs are written to the vault folder set by Log Folder (Vault Only).
How do I see which files a PDMPublisher task created?
Open the task’s Task Details Log tab, which lists the outputs checked into PDM with timestamp, destination, version, source file and folder. Use Open Log File for the complete record, including outputs written outside the vault.
What should I send to PDMPublisher support after a failed job?
The session log saved with Save… immediately after the job (or the task log file from the vault), the profile or task name, the source filename and the expected output. A screenshot of the failing row with Selected output details expanded helps.